Computer processing speeds affect big data

Increasing Processing Speeds with new Memory Storage

One of the biggest pitfalls of our data collection and analysis is our storage capabilities and processing time. We’re limited by what our machines can handle. And though we’re working with more powerful machines than ever before, we still need to break barriers to access even faster processing and larger storage capacities.

Fortunately for us, Intel and Micron Technology have developed the 3D X-Point, a solid-state drive. This technology is four times denser than traditional RAM because it combines RAM and flash storage. This technology is almost 1,000 times faster at reading and writing information because it works even when it’s turned off. This is a revolution in data processing.

You’ll get to try out this new technology in the Intel Optane SSD DC P4800X Series, with a price tag at $1520. But what does this do for the future of data analysis?

What will this do for data analysis?

Essentially, this technology will increase processing speeds by 600%. This works alongside your hard drive, rather than replacing it, making it an ideal solution for data analytics. This kind of technology (which will only get better and more efficient over time) can be an affordable solution to gaining insights from large memory pools.

Why do processing speeds matter?

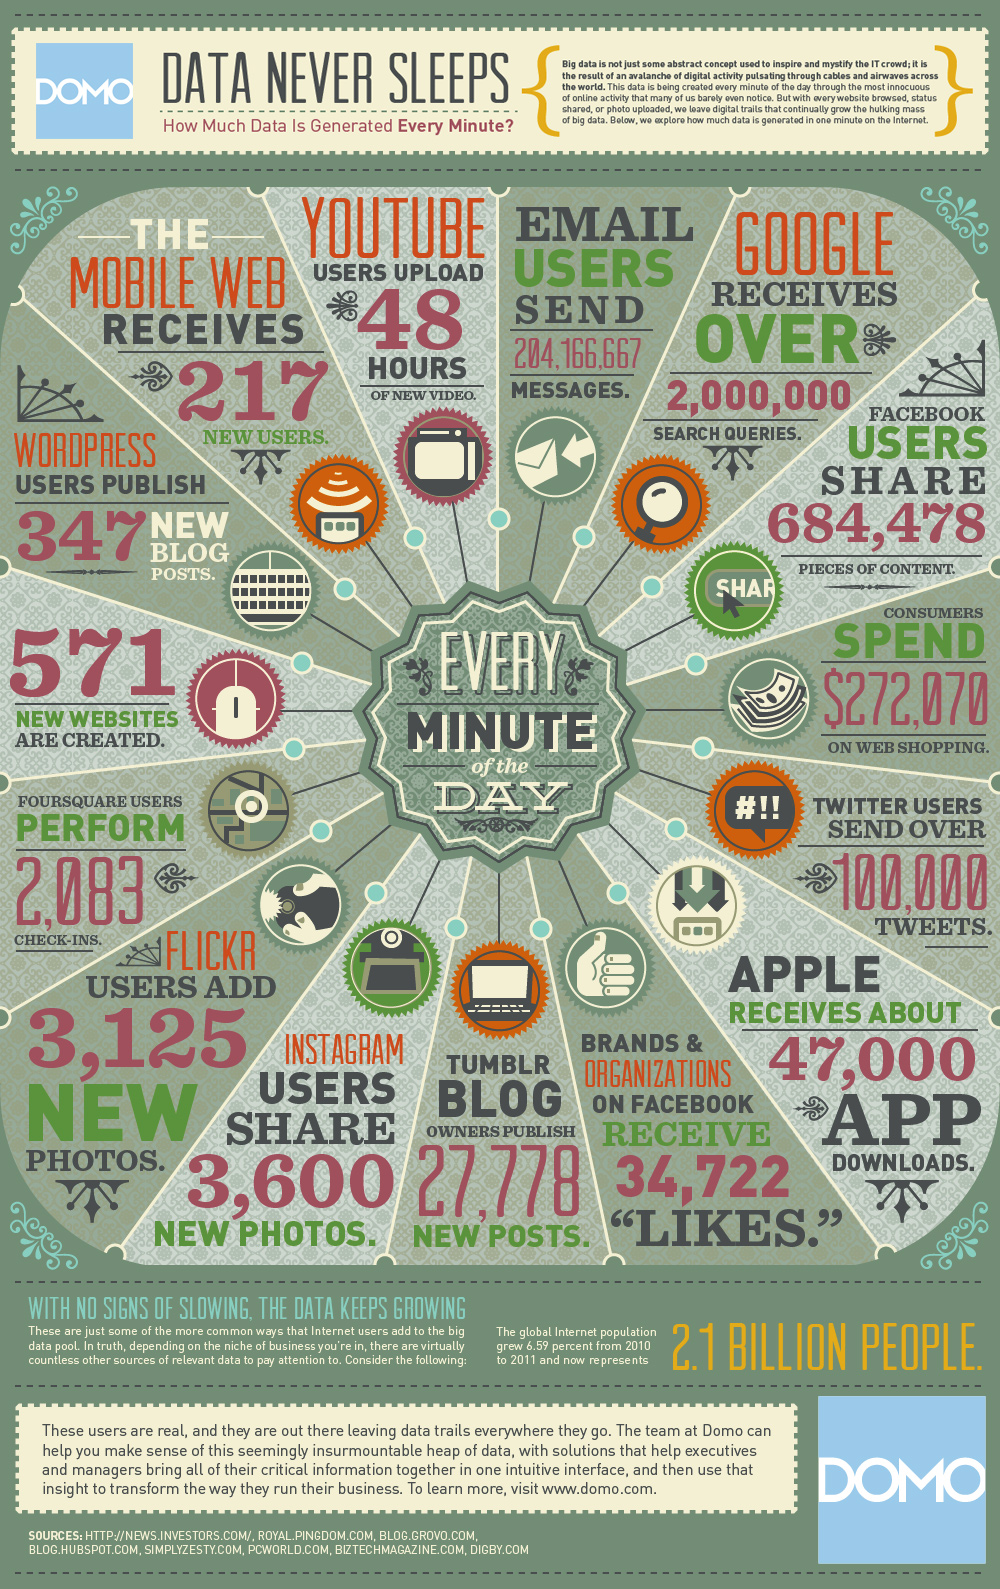
Big data isn’t going away. Let’s look at the amount of data that we generate every minute. You should view the Data Never Sleeps infographic put together by DOMO, but here’s a rundown:

  • Google receives over 2,000,000 search queries
  • Facebook users share 684,478 pieces of content
  • Consumers spend $272,070 on web shopping
  • Twitter users send over 100,000 tweets
  • Apple receives nearly 47,000 app downloads

And there’s even more. This doesn’t count the medical records generated, utilities usage information, articles published, students accepted to universities, etc. Our need for greater processing speeds for data analytics is only increasing by the minute. Literally.

Conclusion

We need better forms of memory storage and processing in order to handle the huge amounts of data that are being produced by the minute.

The technology that Intel and Micron Technology created is a good step in the right direction but is just the frontier of the technology we’ll see and use in the future.

We use state-of-the-art technology to process big data and give you useful visual analytics. Contact us to talk about your data needs and request a pilot.

Is Artificial Intelligence Dangerous?

Is Artificial Intelligence Dangerous? Our Thoughts on the Matter.

If you’ve followed us for some time, you’re well aware that we like to discuss the future of technology, Artificial Intelligence, data, and analytics. And what is at the forefront of thought concerning AI more often than this one question: is artificial intelligence dangerous?

Many thought-leaders, like Stephen Hawking, think AI will be the death of us all. But we don’t quite agree with that doomsday attitude. We think, much like anything in this world, AI and it’s inherent danger or safety is in how we use it. So, really, it’s up to us.

We enjoyed this article on Futurism, titled, “Artificial Intelligence is Only Dangerous if Humans use it Foolishly”. We’ve got a couple of favorite parts of the article that we’ll share here, but you should definitely go read it for yourself and join us in discussing this important question.

There are a lot of concerns over the safety of AI (in most science fiction movies the AI outsmarts us too quickly), and there are very real concerns that AI will replace a large number of jobs (47 percent, according to this study).

There may be a big push to use AI to replace everything and everyone, but as Dom Galeon says, “Moreover, there’s the danger of looking at AI as the magical solution to everything, neglecting the fact that AI and machine learning algorithms are only as good as the data put into them.”

Artificial Intelligence is only as dangerous as we make it.

It’s not the AI we should fear. It’s the way humans will utilize that AI. And while we can sit and imagine numerous doomsday scenarios, the plain fact is that AI will likely replace many of the utilities and jobs we rely on now. Hopefully, this move will improve the human condition. But the AI can only do what we allow it to do. What algorithms are we using? What data are we feeding it? We should keep this in mind so that we don’t let the need get ahead of us.

As Galeon says, “Ultimately, the greatest threat to humanity isn’t AI. It’s how we handle AI.”

What are your thoughts on the future of AI? Should we fear it? Share your ideas in the comments.

How can Big Data help the utilities industry?

How Does Big Data Improve Utilities?

The utilities industry deals with a lot of data. From infrastructure to customer usage, and fgrids to weather monitoring systems. But how can the industry use that data to improve products and services? What started as manually reading meters has changed as technology has evolved. Fortunately, the collection of data has become much more sophisticated. But as more and more data is collected every day, utility companies still struggle to analyze it all.

Basically, there are two main ways to use data to improve the utilities industry. Use it to improve customer services and products, and to improve operational efficiency. This is where our platform comes in to play. Our Pushgraph® platform can handle huge collections of data points and offers real-time computing and visualizations. The utilities industry can use big data analytics to help study and identify patterns of correlated human behavior and energy usage.

Utility companies have been utilizing our Pushgraph® data fusion solutions for Smart Cities. To learn more about Smart Cities, read this recent article published by CNBC.

Contact us to learn more about how we help Utilities companies improve.

We’re constantly working with utility companies to improve their relationship with Big Data. Give us a call or visit our Solutions page for more info.

The Beginner's Guide to Predictive AI

A Beginner’s Guide to Predictive Artificial Intelligence

As you may know by now, many businesses have developed uses for AI (artificial intelligence). Therefore, the implications of AI for the future of healthcare, education, and learning, and robotics (not to mention space travel) are far-reaching and exciting, but it can still be a difficult topic to understand. That’s why we’ve put together a quick guide to Predictive Artificial Intelligence or, AI that can analyze large chunks of data and predict trends and events.  Because we’re big fans of data, analytics, artificial intelligence, and predictive analysis.

What is Predictive Artificial Intelligence?

Basically, Predictive AI is simply artificial intelligence algorithms including pattern recognition, predictive modeling, and advanced data analytics.

How can we use Predictive Artificial Intelligence?

Because there’s no limitation to the uses for predictive AI, we’re only going to list the big ones:

  1. Storm or Weather Predictors
  2. Behavior Recognition
  3. Healthcare, including mental health assessments
  4. Disease outbreaks
  5. Predicting life-span and likelihood of disease/illness

You can read more about these and others by viewing this infographic from Futurism.

AI and predictive analytics can be used to improve the quality of life for everyone in the future, but it’s being used right now in big data and business analytics. Give us a call (812-250-8649) and we can show you how we’re using predictive analytics in our Pushgraph® platform.

Pushgraph® Overview and Features

At ChalkLabs we’re all about powering Knowledge Discovery. We know that data collection doesn’t matter unless businesses, educational institutions, disease research foundations, and government organizations can organize, visualize, and analyze that data. That’s why we focus on more than platforms; we focus on solutions to real-world problems. Here’s a quick Pushgraph® overview. 

At its core, Pushgraph® is a lightning-fast analytics and data visualization platform with an easy-to-use interface. We’ve created a flexible, sustainable, and cost-effective tool that develops long-lasting solutions and relationships.

Leading features include in-memory computing, predictive analysis, semantic search, visual analytics, and security protocols. Visit the Pushgraph section of our website to learn more, or call us to ask for a demo and Pushgraph® overview: 812-250-8649

A List of Big Data Breaches in 2016

2016 was a big year for most of us with a lot of changes. And we can’t argue that there was definitely a lot of stuff going on. While we had many advancements in technology, we also still struggled to keep our information safe, as illustrated by some pretty big data breaches.

You can view the full list of data breaches here. The list includes big names like Yahoo, JP Morgan Chase, eBay, MySpace, and Home Depot. Plus, the site is a great example of visual data.

This year we’ll be covering lots of great topics on the blog. Follow our RSS feed and follow us on LinkedIn and Twitter for announcements and updates.

Happy New Year!

Blue ChalkLabs Text Logo

Map-Based Visualizations

Map-Based Visualizations

When I say the word “data” what do you think of? Probably pages and pages of single-spaced Times New Roman with math symbols and 0.5-inch margins. I’m getting sleepy just thinking about that version of data. The good news is; Data visualization does not have to be boring or hard to read and interpret. Enter: map-based visualizations

Presenting data visually not only helps people understand what you’re showing them (and aids in remembering it), it helps to engage your audience and prove your point. Map-based visualizations are a great way to do that. To prove our point, here’s a list of 7 awesome map-based visualizations.

Map-Based Visualizations Show Data (They Don’t Just Tell It)

Map-based visualizations are a great way to show incredible amounts of data. These data visualizations have become increasingly popular with infographics and maps because these tools help readers to quickly spot trends and make decisions based on the data that would be difficult to see without this presentation.

There’s almost no limit to the number of ways visualizations can be used to organize data and show trends, from communication, transportation, demographics, technology use, utilities… we’ve even seen collections of favorite television shows by location.

If you know of any cool map-based visualizations or infographics, drop the link in the comments so we can check them out.

Photo by William Iven on Unsplash

What is Data Visualization and Why is it Necessary?

Data visualization is a catchphrase these days, but all it really means is attempting to make data pretty to look at. More than looks, though, visual data lets us see and understand trends and information much more quickly and easily.

There are a lot of options for data visualization. In fact, you’ve probably seen a lot of these in the form of infographics and map-based visualizations. Data visualization for big data can include charts, maps, graphs, and whatever other forms allow for data digestion.

Data visualization is essential to understanding trends, predicting events, recognizing patterns, and analyzing large amounts of data. Instead of pouring over hundreds of pages of text-based data and trying to make sense of it all, visual data allows us to immediately view and comprehend millions of data points.

We know how important it is to be able to visually interpret data. That’s why our platform, Pushgraph, allows users to choose the data visualizations that you need to understand all of the data points you’re reviewing. You can learn more about our visual analytics on our website: www.chalklabs.com/pushgraph

Big Data Explained

Big Data Explained: What is it and Why does it Matter?

Big data can be a confusing term, but it’s really just a broad umbrella category for large amounts of information. These data sets can be analyzed to reveal information regarding trends, associations, patterns, behavior, and can even predict future events/behavior.

Big data is used in many sectors from government to health to education, and as our abilities to analyze data grows, so does our understanding of what big data can do for us.

Before any sort of computational analysis was available, humans spent their lives pouring over data and providing research and recommendations to businesses and governments. This may have been accurate (it may not have been), but it certainly wasn’t as useful as it could be.

That’s where big data analysis comes into play. Computing power gives us the ability to mine trillions of data points and compile them into one place. What we do with the data after that is up to us.

If we can mine the data we need, sort through it, and present it visually, we can use the information to predict storms, end disease, improve our cities and transportation, and even search for life on other planets.

We’ve always had access to big data in theory. But now we can actually put that theory into practice and start using the information to make informed decisions for our businesses, health, countries, institutions of learning, and more.

Creating Smart Cities with Apps

Technology continues to fuel population growth with new applications targeting Big Data analytics and data mining, which are opening up a whole new world for us. Transportation, health and safety, and budget efficiency can all be vastly improved by applying sensor technology and real-time tracking devices to real life objects or events.

Apps like GasBuddy, FitBit, and ParkSight 2.0 are already initiating changes to society. The Streetlines company made the Park Sight 2.0 app that can show the driver where the nearest open parking spot is, saving them time and gasoline expenditures. In most cities parking is near the top of the list of highest revenues. Locating seats on a nearby bus, searching for safe biking routes, and knowing what charities are in need of the items you were about to toss out could be huge factors in changing the way our cities operate. Portland is a good example of a city which is benefiting from adopting the use of bike-friendly apps. There are vast benefits of providing our citizens with knowledge of changes we could make to help our city be a smart one. How might fewer people be injured while biking? If you knew you could save money on gas by finding a ride share service or a safe biking route by using an app on your iPhone would you ditch your gas-guzzling F-150 for a 10 speed and a helmet?

Transportation is a large part of our economic structure and with improvements, we can make everyone’s lives easier, safer and more efficient.